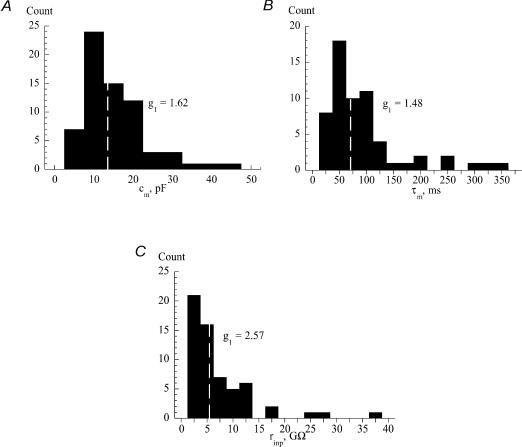
Figure 1. Histograms of electrical characteristics of guinea-pig suburothelial myofibroblasts.
A, membrane capacitance, cm. B, membrane time constant, τm. C, input resistance, rinp. The white dotted line in each part shows the median value. The skewness values, g1, of each data set are shown in the relevant part.

