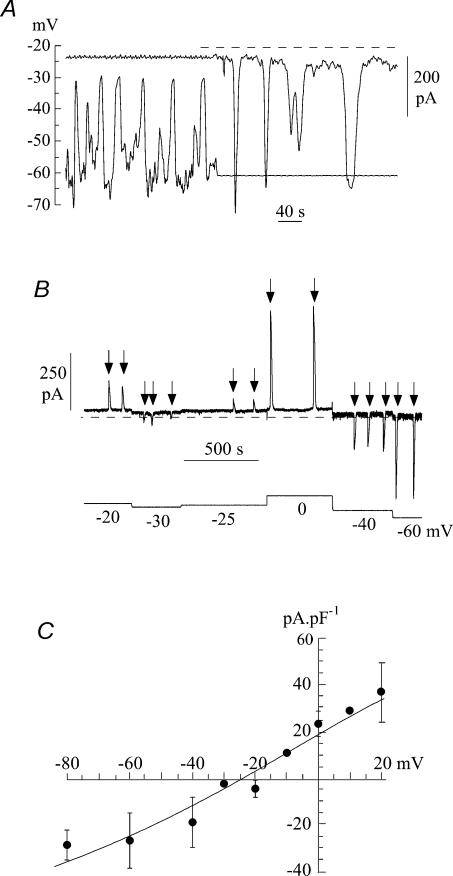
Figure 2. Spontaneous currents in suburothelial myofibroblasts.
A, current- and voltage-clamp recordings from an isolated cell using a Cs+-filled pipette. The first half of the record is under current-clamp; the second half shows ionic current recorded when voltage-clamped at −60 mV. Dotted line shows the zero-current level. B, voltage dependence of spontaneous currents under voltage-clamp: holding potential was varied between −60 and 0 mV in this example in a series of steps. Spontaneous currents are arrowed. C, current–voltage relationship of spontaneous currents from seven cells. Mean ±s.d. of data; the straight line was fitted by least-squares analysis of the mean data.

