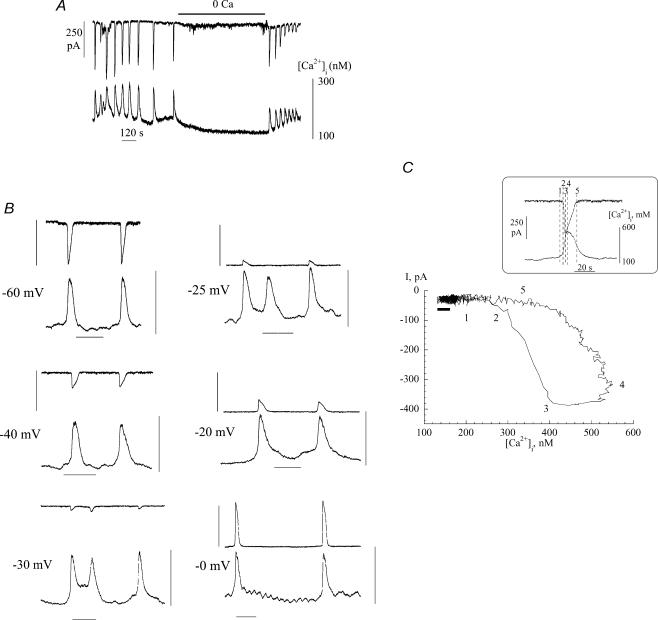
Figure 3. Spontaneous currents and Ca2+-transients in suburothelial myofibroblasts.
A, simultaneous recording of inward currents and [Ca2+]i; holding potential −60 mV. B, voltage dependence of spontaneous currents and Ca2+-transients; the holding potential is denoted beside each pair of traces. Vertical bars: 400 pA for upper trace, 100–600 nm[Ca2+]i for lower trace; horizontal bar: 1 minute. C, phase-plane plot of the relationship between current and [Ca2+]i. The recordings used to generate the plot are shown in the box, the numbers refer to different times within the plots. The horizontal black bar below the left limb of the plot shows the inherent noise in the traces used to generate the plot. The thickness of the line represents the variance of current noise; the length is the variance of the [Ca2+] signal noise. Because the change of [Ca2+], before current is evoked, is greater than the length of this bar the observation that [Ca2+] changes before current is generated is a real phenomenon and not a random event due to variations of noise in the signals.

