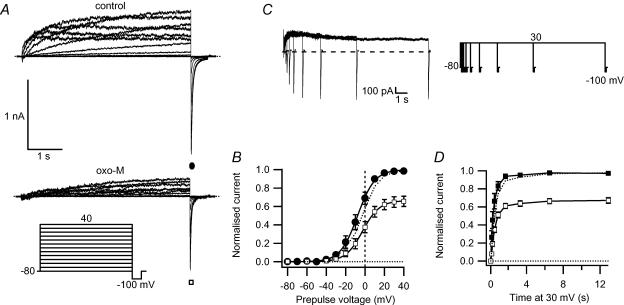
Figure 2. M1R stimulation reduces maximal erg current activation.
A, erg currents elicited by the activation protocol (inset) before and during 10 μm oxo-M. B, maximal tail current amplitudes, taken at −100 mV after stepping to different voltages for 5 s, for control (•) and after treatment with oxo-M (□, n = 7). Values normalized to maximal current under control conditions are plotted against the prepulse potential. The dotted curve shows the current after oxo-M scaled to the control current amplitude. C, tail-current pulse protocol and representative current traces for the time dependence of activation. D, time course of activation, with normalized tail current shown at different times, for control (▪), after oxo-M (□), and after oxo-M scaled to control (dotted line).

