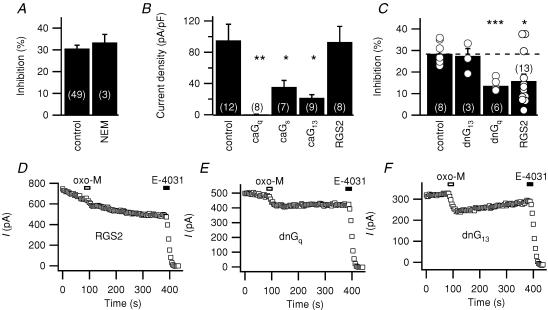
Figure 5. G protein involvement in muscarinic suppression of erg.
A, muscarinic suppression of current in control cells and cells preincubated with the Gi/o inhibitor N-ethylmaleimide (NEM; 50 μm) for 2 min. The test pulse protocol for this and subsequent experiments is as in Fig. 1. B, initial density of current in cells overexpressing constitutively active forms of Gq, Gs or G13 (caGq, caGs or caG13) or RGS2. *P≤ 0.05 and **P≤ 0.005 indicate significant difference from controls. C, percentage suppression in cells overexpressing dominant-negative G13 or Gq (dnG13, dnGq), or RGS2. Individual observations are shown as open circles. *P≤ 0.05 and ***P≤ 0.0005 indicate significant difference from controls. D, E and F, representative time courses of test currents during inhibition by oxo-M in cells cotransfected with the indicated genes. For RGS2, the example is representative of 10/13 cells.

