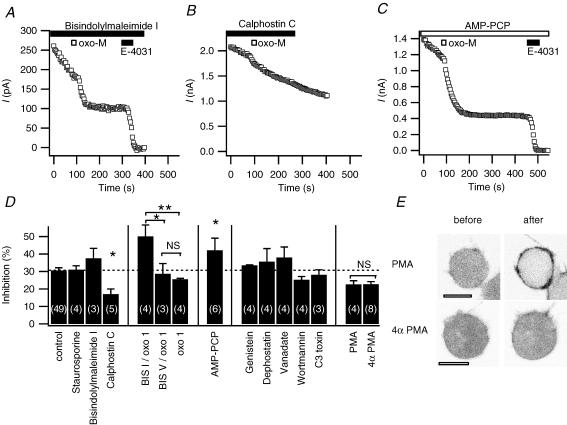
Figure 7. Kinases are not involved in erg current inhibition by oxo-M.
A, B and C, erg current inhibition by oxo-M after pretreatment with bisindolylmaleimide I (1 μm in the bath, following preincubation for 20–50 min), calphostin C (1 μm in the bath), and AMP-PCP (4 mm in the pipette, no ATP). Application in the bath is indicated by filled bars and application in the pipette solution by open bars. D, amplitude of muscarinic inhibition under control conditions and after applying one of the following: staurosporine, bisindolylmaleimide I, bisindolylmaleimide V, or calphostin C (1 μm); AMP-PCP replacing all ATP in the pipette (4 mm AMP-PCP); genistein (50 μm); dephostatin (50 μm); orthovanadate (0.5 mm); wortmannin (30 μm); or C3 toxin (3 μg ml−1 in the pipette solution with 1 mm NADPH); phorbol 12-myristate 13-acetate (PMA; 500 nm); or 4αPMA (500 nm). In one group of experiments, 1 μm oxo-M was used as indicated (oxo 1) instead of 10 μm oxo-M, and compared to same-day controls. Application of oxo-M was > 5 min after achieving whole-cell configuration to allow for diffusion of substances from the pipette. Inhibitors were applied in the bath for > 5 min prior to oxo-M, except for PMA (2 min) and bisindolylmaleimide I and V (additional > 20 min preincubation). NS, not significant, *P≤ 0.05, **P≤ 0.01. E, representative confocal images of cells transfected with the PKC-C1-EGFP probe and M1R, 3 min after a 2 min treatment with either PMA (n = 5) or 4αPMA (n = 4). Images are in negative contrast so that fluorescence is black. Scale bars are 10 μm.

