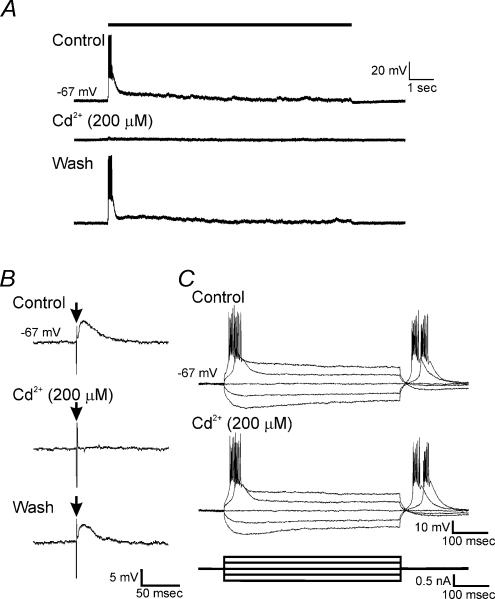
Figure 4. Cd2+ selectively blocked sDBS responses.
A, membrane responses to sDBS before, during bath application of Cd2+, and after washout. B, representative trace of single shock-evoked EPSPs before, during bath application of 200 μm Cd2+, and after washout. Vertical excursion, indicated by arrow (↓), is stimulus artifact. C, current injection pulses recorded before and during bath application of 200 μm Cd2+. Note that the T-type Ca2+ channel-dependent LTS remains unchanged in the presence of 200 μm Cd2+. All recordings were obtained from the same cell.

