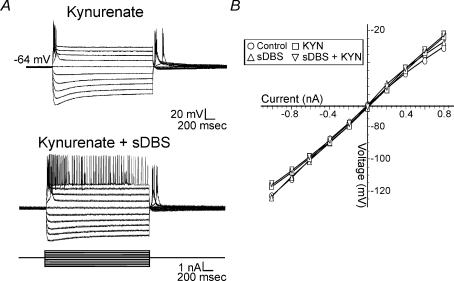
Figure 7. Effects of sDBS on membrane conductance.
A, step current injections were used to obtain a I–V curve both during control sDBS or in the presence of kynurenate. Similar results were obtained for both type 1 and type 2 sDBS membrane responses. A representative trace from a type 2 response is displayed. B, no significant change in steady-state conductance during control (○), sDBS (Δ), kynurenate (□), or sDBS + kynurenate (∇). Each data point is derived from a minimum of 5 cells.

