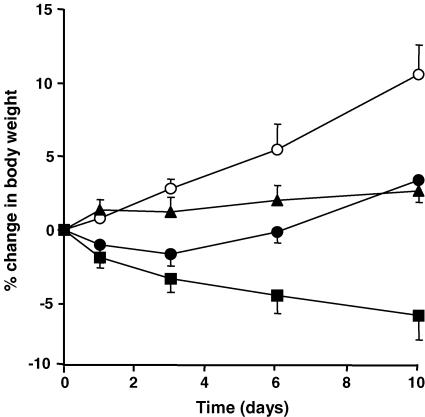
Figure 2. Body weight.
Weights in control non-inflamed animals (○) increased in a time-dependent fashion (P < 0.0001, one-way ANOVA), differing significantly from vehicle-treated AIA (•), SC-236 (▴) and indomethacin (▪) groups (P < 0.0001, 0.0004 and 0.0001, respectively, two-way ANOVA). Animal weights in both vehicle- and SC-236-treated groups did not significantly differ with time, but decreased in the indomethacin-treated group (P < 0.029, one-way ANOVA). Body weights of SC-236 and vehicle groups differed significantly from those of the indomethacin group (P < 0.0001, respectively, two-way ANOVA). Data presented as mean ±s.e.m. (n = 5–6).

