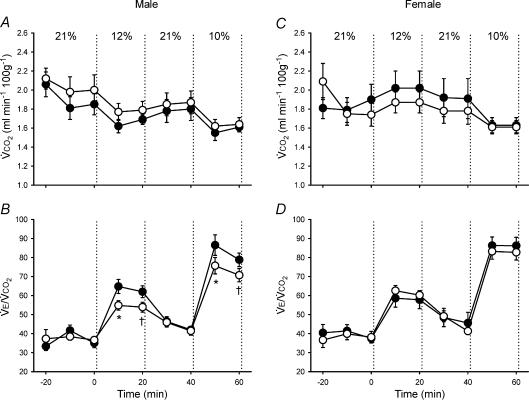
Figure 3. Changes in metabolism (metabolic CO2 production (V˙CO2)) and ventilation-to-metabolism ratio (V˙E/V˙CO2)during hypoxia in unanaesthetized male (A–B) and female (C–D) rats.
Values (mean ±s.e.m.) are given for 10 min bins throughout the experimental protocol (21% O2–12% O2–21% O2–10% O2); inspired O2 was switched from baseline (21% O2) to hypoxia at 0 min. Data are from adult rats raised in hypoxia for the first postnatal week (neonatal hypoxia (○): n = 11 males, 6 females) or in room air (control (•): n = 11 males, 10 females). *P < 0.05versus control at the same level of hypoxia, †0.05 < P < 0.10versus control at the same level of hypoxia.

