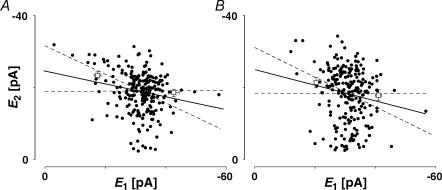
Figure 3. The properties of synaptic depression are stable.
A, plot of second versus first EPSCs for a layer V pair for the first hour of a prolonged recording period. RD = 0.45 ± 0.15 (N = 228, r = −0.42, pr < 0.05). B, plot of second versus first EPSCs for the same connection after 3 h of recording. The RD of 0.53 ± 0.22 (N = 238, r =−0.38, pr < 0.05) is not different (pt= 0.7) from that in A and in both cases the linear regression line is significantly different from a horizontal line. The open squares indicate  smallE1 and
  bigE1.

