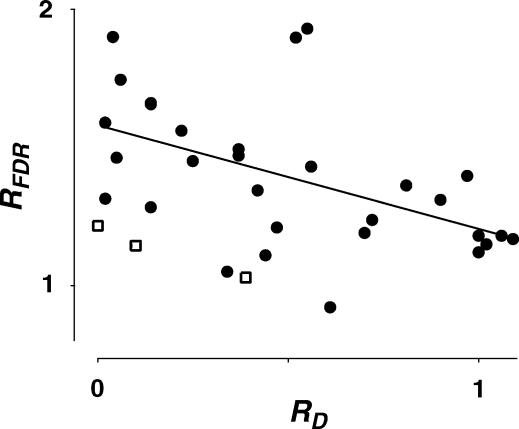
Figure 8. Correlation between RFDR and RD.
The ratio of the normalized recovery amplitude following a burst at 10 and 20 Hz (RFDR) is plotted against RD(determined at 20 Hz) of layer V connections (filled circles) and 3 layer IV connections (open squares). There was a significant correlation between the two parameters as indicated by the linear regression for layer V connections (r =−0.51, pr < 0.005).

