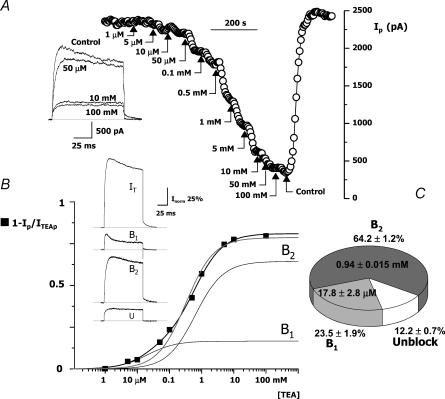
Figure 3. Effect of TEA on the outward K+ currents of CB chemoreceptor cells.
A, peak current amplitude obtained in depolarizing pulses to +40 mV applied every 5 s in a cell while increasing concentrations of TEA were applied in the bath solution as indicated. The inset shows four representative traces obtained at the beginning of the experiment (control) and in the presence of 50 μm, 10 mm and 100 mm TEA. The figure also illustrates the full recovery of the current amplitude after TEA removal. B, TEA dose–response curve obtained with data from the same cell (▪) were fitted to a one-binding-site model (grey line) or a two-binding-site model (black line). The data were best fitted with the two-binding-site model. The functions representing the two components are also shown in the figure (B1 and B2). The inset shows the traces obtained in control conditions (IT) and the subtracted traces corresponding to the high (B1 = IT − ITEA50 μM) and low (B2 = ITEA50 μM−ITEA100 mM) TEA sensitivity and the unblock (U = ITEA100mM) fraction of the currents. C, the pie chart shows the average normalized distribution of the three components with the mean IC50 obtained from seven cells.

