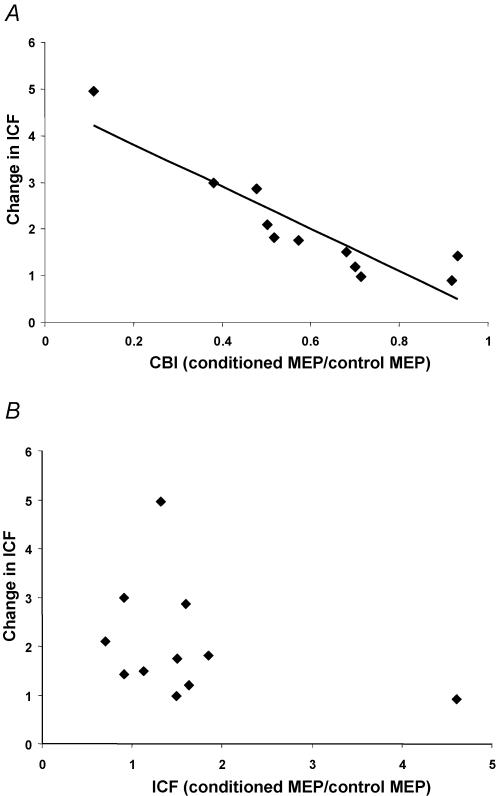
Figure 5. Effects of the strengths of CBI and ICF on CBI—ICF interaction.
Data are from 11 subjects and each point represents 1 subject. A, the relationship between CBI and the change in ICF in the presence of CBI. CBI is expressed as a ratio of the conditioned MEP amplitude to the unconditioned MEP amplitude (2H/2E). The y-axis represents a ratio of ICF in the presence of CBI (2J/2H) to ICF alone (2G/2E). Change in ICF was significantly correlated with the strength of CBI. B, the relationship between ICF and the change in ICF in the presence of CBI. ICF is expressed as a ratio of the conditioned MEP amplitude to the unconditioned MEP amplitude (2G/2E). The y-axis represents a ratio of the ICF in the presence of CBI (2J/2H) to ICF alone (2G/2E). There was no correlation.

