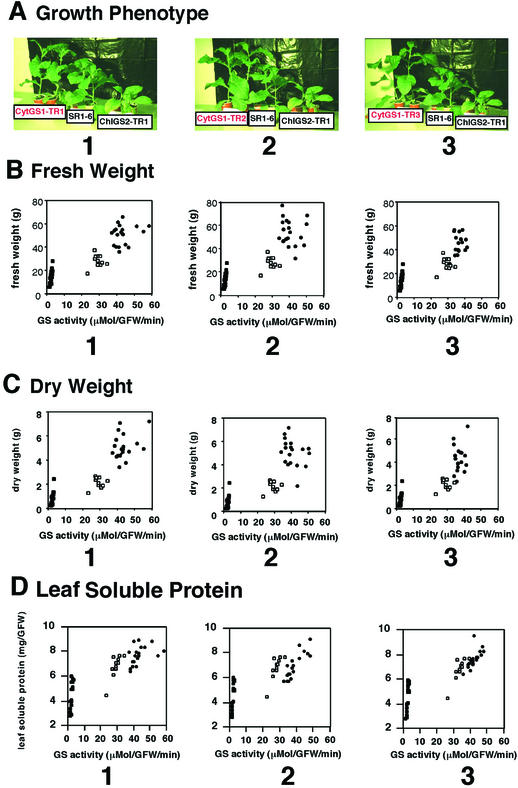
Figure 2.
Qualitative and quantitative growth phenotype of GS transgenic plants. A, Plants from the control line (SR1–6) and the cosuppressed chloroplastic GS2 (ChlGS2-TR) line are shown next to three independent lines of cytosolic GS1 overexpressors: CytGS1-TR1 (1), CytGS1-TR2 (2), and CytGS1-TR3 (3). The same ameliorated growth phenotype was also observed in another independent CytGS1-TR line, CytGS1-TR4 (not shown). B through D, Growth analysis of cytosolic GS1 overexpressor lines (●) CytGS1-TR1 (1), CytGS1-TR2 (2), and CytGS1-TR3 (3). Also represented are the control tobacco line (SR1–6, □) and the cosuppressed chloroplastic GS2 line (ChlGS2-TR, ▪). The growth assays were performed in 19 plants for the CytGS1-TR or ChlGS2-TR lines and 10 plants for the SR1–6 line. All plants were analyzed individually for total plant fresh weight (B), dry weight (C), and soluble protein (D) as a function of total leaf GS specific activity (Shapiro and Stadtman, 1971). The plants were grown and assayed as described in “Materials and Methods.”

