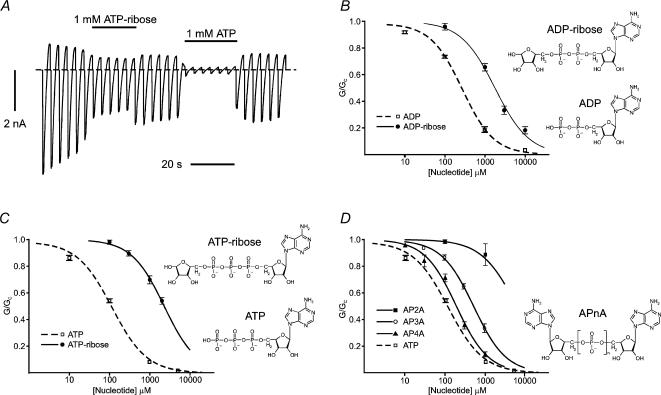
Figure 1. Effects of modifying the phosphate tail on Kir6.2ΔC currents.
A, macroscopic current recorded from an inside-out patch in response to a series of voltage ramps from −110 to +100 mV from oocytes expressing Kir6.2ΔC. 1 mm ATP-ribose or 1 mm ATP was added as indicated by the horizontal bars. The dashed line indicates the zero current potential. B–D, concentration–inhibition curves for adenine nucleotide inhibition of Kir6.2ΔC currents. B, ADP (□, n = 5) (data from Tucker et al. 1998) and ADP-ribose (•, n = 6); C, ATP (□, n = 11) (data from Gribble et al. 1998) and ATP-ribose (•, n = 5); D, A[P]nA. (AP2A: ▪, n = 5; AP3A: ○, n = 6; AP4A: ▴, n = 6) compared to ATP (□, n = 11). The macroscopic conductance in the presence of nucleotide (G) is expressed as a fraction of that measured in nucleotide-free solution (GC). The lines are the best fits to eqn (1). Mean nucleotide concentrations at which inhibition is half-maximal (IC50) are given in the text. Chemical structures of the nucleotides are shown to the right of the individual concentration–inhibition curves.

