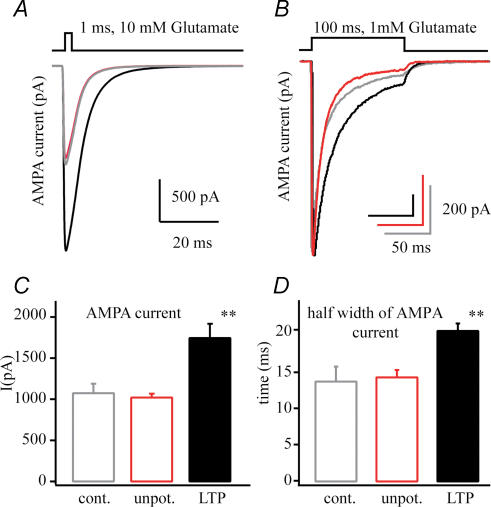
Figure 2. AMPA current changes following LTP.
A, representative average AMPA currents from patches pulled from a control (grey), an unpotentiated neurone (50 μm APV and 10 μm MK-801, red) and a potentiated neurone (100 Hz tetanus, black) showing the increase in current amplitude that selectively occurs following LTP induction. B, average AMPA currents evoked by 100 ms 1 mm glutamate application showing the increased current duration following potentiation. C, numerical representation of the AMPA current amplitude of patches excised from control (n = 7), unpotentiated (n = 12) and potentiated (n = 11) neurones. D, half-width of AMPA currents quantifying the significant increase of AMPA current duration followed by LTP (**P < 0.01).

