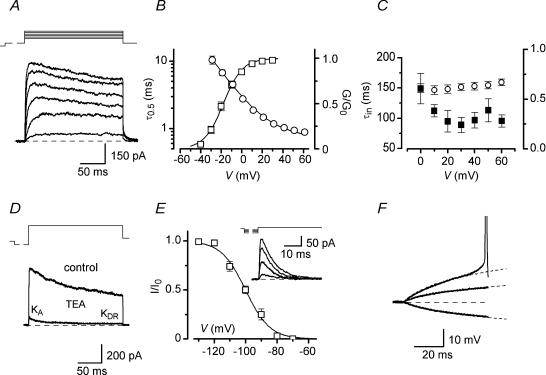
Figure 4. Voltage-gated K+ channels in AFNs.
A, KDR currents in patches activated in ACSF* by 200 ms depolarizing pulses (from −30 mV to +20 mV in a 10 mV step) following a 150 ms prepulse to −60 mV. Holding potential, −80 mV. These traces were off-line low-pass filtered at 1 kHz. B, steady-state activation curve (□) and the rise time of a half-maximum current (τ0.5, ○). C, the time constant of inactivation (▪) and the ratio of currents measured at peak and at the end of the pulse (○) at different potentials. D, separation of transient KA currents in patches. Total K+ current activated in a nucleated patch by a voltage step from −120 (150 ms) to +60 mV (200 ms) in the presence and absence of 10 mm TEA. Holding potential, −80 mV. E, steady-state inactivation of KA current. Whole-cell KA currents were recorded at −50 mV after a 150 ms prepulse to varying potentials (−130, −110, −100 and −90 mV). Holding potential, −80 mV. F, analysis of subthreshold current-clamp responses to injection of current pulses. AFN was stimulated by −10, +10 and +20 pA currents. A response to −10 pA current was considered as passive. It was digitally multiplied by factors of −1 and −2 (shown by dashed curves) and shown superimposed on the other two traces.

