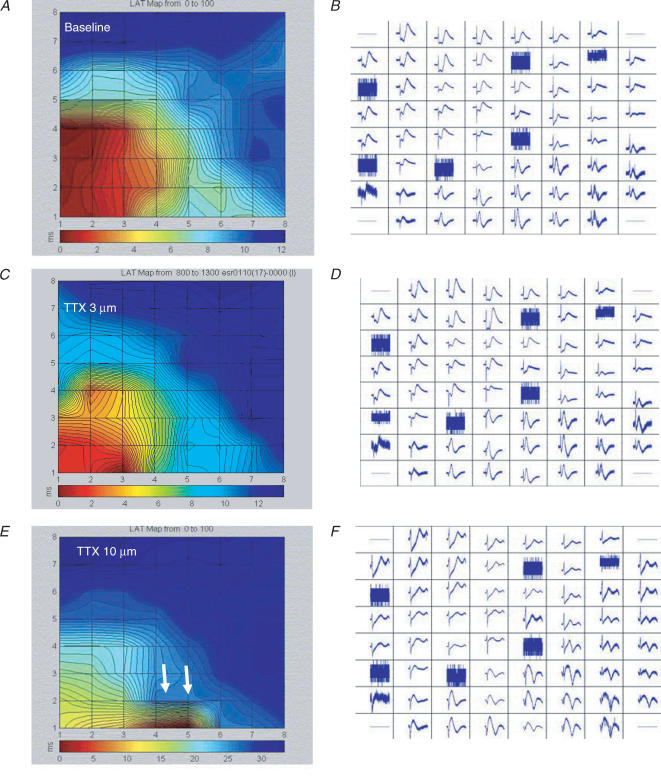
Figure 1. MEA – Na+ channel block, but not Ca2+ channel block slows conductionb.
A and B, simultaneous extracellular tracings from all 60 electrodes (B) recorded from a beating EB and the resulting high-resolution activation map (A) as generated by the MEA mapping technique, during baseline recordings. C–F, extracellular recordings (D,F) and activation maps (C,E) generated from the same EB following application of 3 μm (C,D) and 10 μm (E,F) TTX. Note the increase in total MEA activation time from a baseline value of 11.5 ms to 14.0 ms (C) to 35.0 ms (E). In some of the EBs application of TTX (10 μm) also resulted in the generation of local conduction blocks (white arrows).

