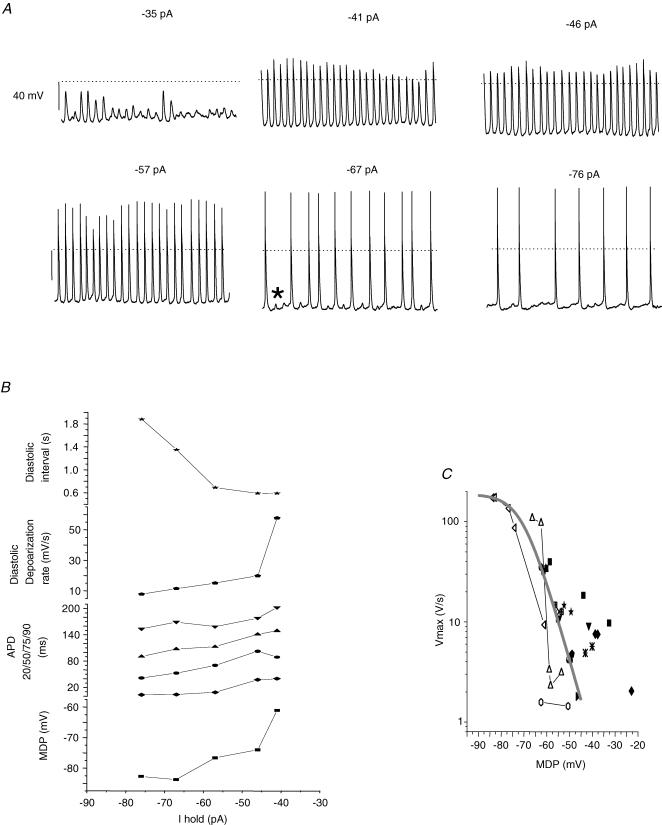
Figure 7. Spontaneous AP generation corresponds to a window of voltages that corresponds to the overlap of Na+ channel activation and inactivation.
A, representative single cell APs recorded from the whole-cell configuration. The amplitude of constant holding current is listed above each subpanel. Dotted line is 0 mV; scale bar 40 mV 15 s of continuous data shown for each panel. Asterisk in bottom centre panel shows typical ‘failed’ AP initiation. B, AP parameters plotted as a function of holding current for cell shown in A. C, pooled data from 3 single cells and 14 cell cluster recordings. Individual symbol types depict separate recordings. Vmax is plotted as a function of MDP. The smooth grey line is a Boltzmann distribution with a midpoint of −72.5 mV, a slope of 5.4 and a maximum of 118.

