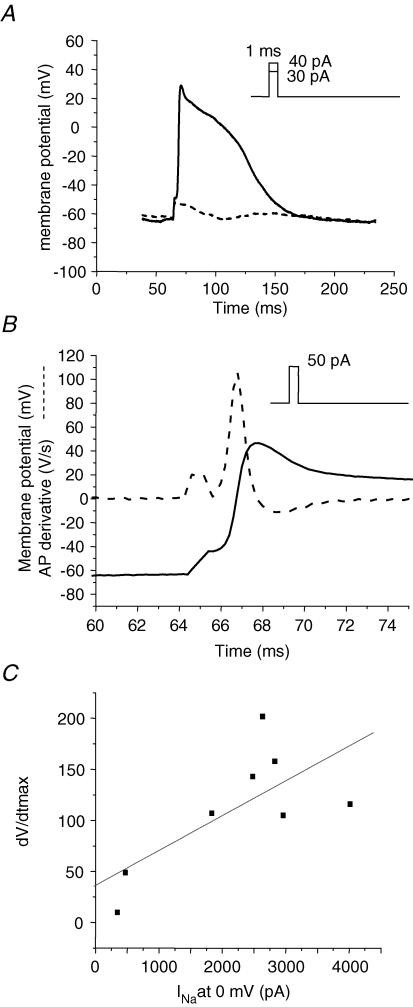
Figure 8. Single cell APs are stimulated with small, brief current pulses.
A, representative AP elicited by a 1 ms duration, 40 pA current injection (continuous line) superimposed on the Vm response to a subthreshold stimulus (dashed line). Constant holding current maintained MDP ∼−65 mV (29 pA in this example). B, a supra-threshold stimulus (50 pA) elicits an AP upstroke (continuous line) with a rapid Vmax. Dashed line superimposed on AP is the AP derivative to illustrate dV/dtmax (Vmax). Note the expanded time scale relative to A to illustrate rate of rise of AP. C, a subset of 9 cells in which Na+ current was recorded following single cell APs. Vmax is plotted as a function of Na+ current. Linear regression (R) = 0.71.

