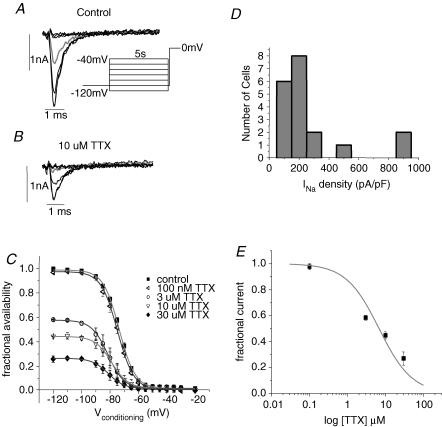
Figure 9. Steady-state inactivation and TTX blockade of hES-CM INaare similar to that for cardiac Na+ channels.
A, current traces elicited by a test potential step to 0 mV following 5 s conditioning steps to −120, −100, −80, −70, −60, −50 and −40 mV under control ionic conditions. Grey current trace is for conditioning voltage step to −70 mV. B, same voltage protocol and same current traces shown as in A, but in the presence of 3 μm TTX. Grey trace is also the current elicited following a conditioning step to −70 mV. C, normalized steady-state inactivation curve in control bath and for TTX concentrations as indicated; n = 12. Smooth line is Boltzmann distribution with the following values for half-activation (V½) and slope factors (k): control (▪), −73 mV and 5.6; 0.1 μm TTX (◃), −74 mV and 5.8; 3 μm TTX (○), −81 mV and 5.8; 10 μm TTX (▽), −79 mV and 5.8; 30 μm TTX (♦), −81 mV and 5.7. D, distribution of current density of cells from peak current obtained from the steady-state inactivation protocol. Bin width is 100 pA pF−1. E, TTX dose–response relationship fitted with a single site blocking curve of the form: fractional block = 1/(1 + [TTX]/Kd) with Kd = 6.8 μm.

