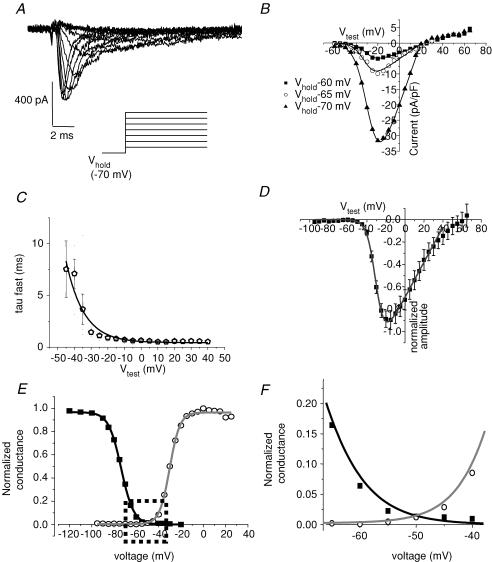
Figure 10. INa in response to increasing depolarizations.
A, current traces elicited from Vhold −70 mV to depolarizations ranging from −60 to −5 mV in 5 mV increments in a representative cell. B, current–voltage relationship for peak inward current of a representative cell for Vhold −60 (▪), −65 (○), and −70 mV (▴). Smooth curve is a modified Boltzmann distribution where, G(V) = Gmax(Vtest – Erev))/{1 + exp((V½ – Vtest)/k}, with half-activation (V½) and slope factors (k) of −30 mV and 5.2 for Vhold = −60 mV; −31 mV and 5.1 for Vhold = −65 mV; −29 mV and 5.9 for Vhold = −70 mV. C, macroscopic current decay was fitted to a bi-exponential function. τfast is plotted as a function of test potential (Vtest). Curve is a single exponential fit of τfast with a maximum rate of 0.4 ms. D, normalized pooled data for peak inward current elicited by various test potentials. Smooth curve is a modified Boltzmann distribution with V½ = −30 mV, k = 4.6, and Erev = 44 mV; n = 21. E, conductance transform of D (activation curve, grey line) superimposed on the normalized peak steady-state inactivation curve from Fig. 9C. Dashed box indicates approximate boundaries of the potential range for diastolic depolarization. F, expanded view of the dashed box in E to illustrate the overlapping window of potentials where Na+ channels may simultaneously activate and are partially available to activate.

