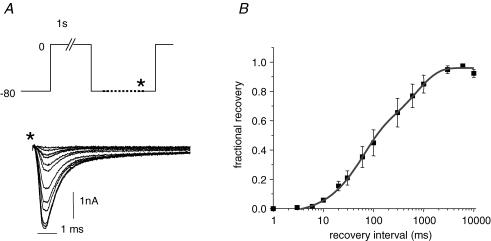
Figure 11. Time course of recovery from inactivation of INa.
A, schematic diagram of protocol used to assess recovery from inactivation. Cell was returned to −80 mV for a variable duration following a 1 s depolarization to 0 mV. Data acquisition was initiated as indicated by asterisk. Representative current traces elicited by final test step to 0 mV for recovery intervals listed in the graph in B. Scale bars 1 ms and 1 nA. B, pooled, normalized recovery from inactivation data is fitted by a bi-exponential function with time constants of 57 ms (55% of the amplitude) and 457 ms (45% of the amplitude). Peak current was normalized to current recovery following a 10 s interpulse interval.

