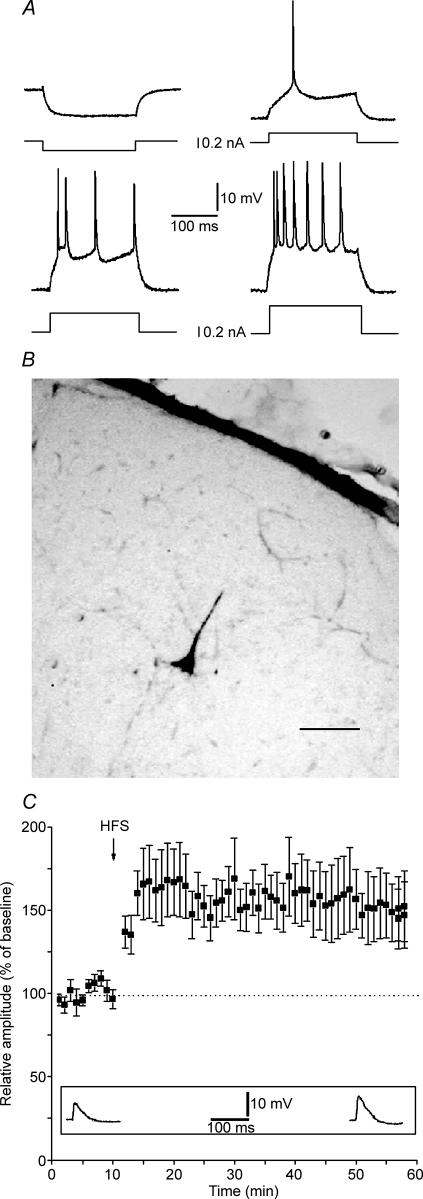
Figure 1. Regular spiking cells (RS) of the rat visual cortex express LTP.
A, characteristic RS response to intracellular current pulses of different intensities. Spike discharge pattern of typical RS neurone in layer II–III of area 17 during injection of current pulses (200 ms). Recording was done at Vm = −70. Different intensities and polarity of injected currents are reported in the four panels. B, intracellularly recorded RS neurone labelled by injection of 0.5% biocytin dissolved in 2 m potassium acetate solution. Scale bar = 80 μm. C, long-term potentiation of EPSPs in RS following HFS. Values indicate mean EPSP amplitudes ± s.e.m. Inset depicts EPSPs from a representative neurone recorded before HFS and at the 50th minute after HFS.

