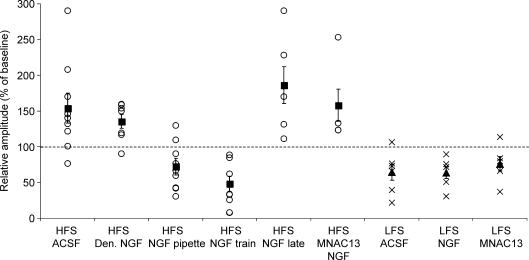
Figure 5. Summary of averaged EPSPs amplitudes of recorded neurones grouped for each kind of treatment.
○, the relative mean EPSP amplitude of each cell recorded from 40 to 50 min after the HFS, compared with baseline. ×, the relative mean EPSP amplitude of each cell recorded from 45 to 55 min after LFS, compared with baseline. ▪ and ▴, the mean change in EPSP amplitude for each treatment. Denatured and pipette NGF were locally applied using coaxial electrode. NGF train, NGF treatment during HFS; NGF late, NGF treatment 10 min after HFS; HFS MNCA13, NGF treatment during HFS in slices incubated in ACSF containing anti-TrkA antibody; HFS and LFS ACSF, HFS and LFS in control slices perfused with ACSF; LFS NGF, NGF treatment during LFS; LFS MNCA13, LFS elicited in slices incubated in ACSF containing anti-TrkA antibody. Statistical comparisons among different groups: (HFS stimulation: ACSF versus pipette NGF, P = 0.003; ACSF versus denatured NGF, P > 0.05; ACSF versus NGF train, P = 0.0008; pipette NGF versus NGF train, P > 0.05; LFS-induced LTD was not significantly different among all groups).

