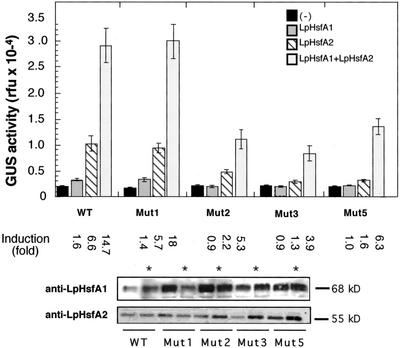
Figure 5.
Effect of the HSE mutations on synergistic activation of the Ha hsp17.6 G1 promoter by LpHsfA2 and LpHsfA1. Bars represent average GUS activity determined in tobacco protoplasts transformed with different combinations of reporter and effector plasmids. Results correspond to three independent experiments for each plasmid combination, with GUS activity measured in triplicate in each experimental repetition. The chimeric genes, indicated by WT, Mut1, Mut2, Mut3, and Mut5, correspond to the natural and mutant HSE denominations of the GUS fusions in Figure 1. Each reporter gene was transformed without (−) and with the effector plasmids for the Hsfs indicated in the upper right corner. Induction is the ratio between activities obtained with and without effector plasmid(s). Statistical values for relevant comparisons of observed induced activities: WT with LpHsfA2 versus no effector plasmid (F = 119.6, P = 0.001). WT with LpHsfA1 + LpHsfA2 versus the addition of the activities separately obtained with each Hsf (F = 19.6, P = 0.0001). WT versus Mut1 with LpHsfA1 + LpHsfA2 (F = 0.047, P = 0.83). WT versus Mut2 (F = 33.7, P = 0.0001), Mut3 (F = 58.7, P = 0.0001), or Mut5 (F = 20.6, P = 0.0001), in all cases with LpHsfA1 + LpHsfA2. Statistical significance as in the legend of Figure 2. Panels below depict the verification, by western immunodetection, of expression levels for LpHsfA1 and LpHsfA2 in each experimental combination. For combinations simultaneously expressing LpHsfA1 and LpHsfA2, the same protein samples were used for sequential detection of both Hsfs (marked with asterisks).

