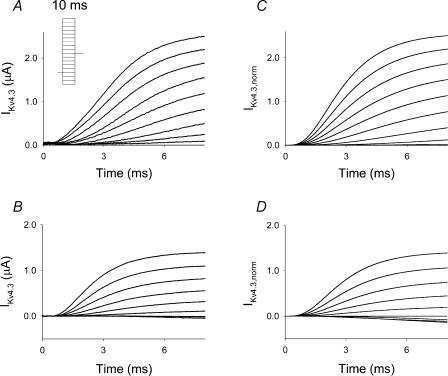
Figure 2. Series of experimental traces of activation of IKv4.3 obtained at different [K+]o, 2 mm (A) and 98 mm (B), and simulated traces of activation of IKv4.3 for different [K+]o, 2 mm (C) and 98 mm (D).
A series of 10 ms voltage steps were applied from a holding potential of −90 mV ranging between −120 and +50 mV in 10 mV steps using the cut-open voltage clamp technique. Capacitance transients were subtracted by fitting with exponential functions. Simulated traces were generated using the same experimental protocol as described above in A and B and are based on a discrete state Markov model. Depolarization pulses during simulations were applied at the end of a 20 ms holding potential at which time test depolarizations were initiated and designated as occurring at t = 0 ms. A 20 ms holding potential was used to allow the channel to reach equilibrium. Traces were normalized to the experimental value of IKv4.3 at the end of the depolarization pulse to +50 mV and at 2 and 98 mm[K+]o. Inset in A, voltage clamp protocol, used for generation of IKv4.3 traces.

