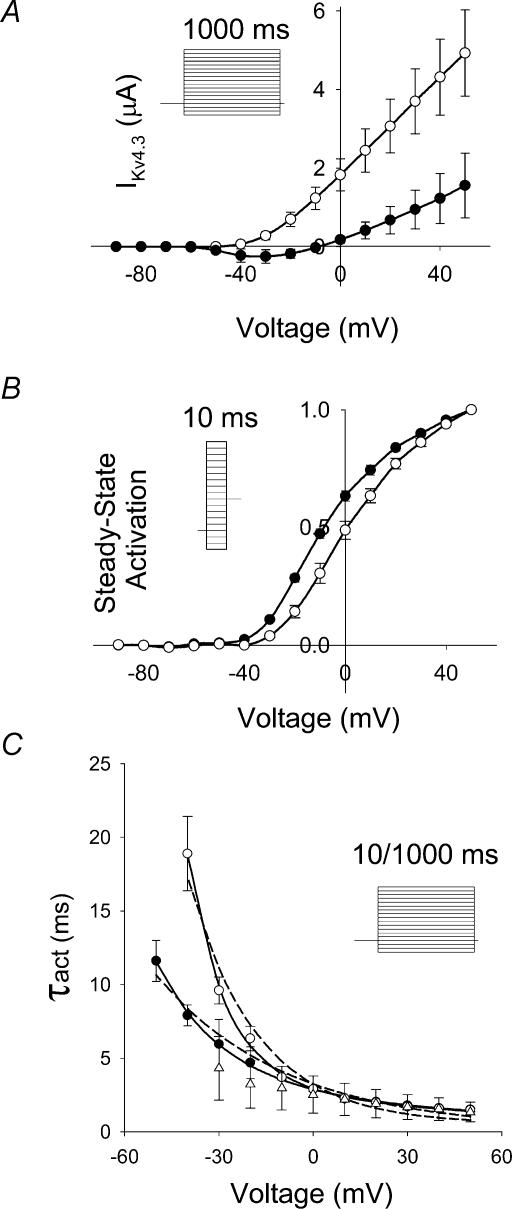
Figure 3. Effects of two different extracellular [K+] on peak I–V relationship and activation properties.
A, experimental I–V relationship for IKv4.3, 2 mm (○, n = 5) and 98 mm (•, n = 4). Data were obtained using 1000 ms voltage steps from a holding potential of −90 mV to variable voltages ranging between −120 and +50 mV in 10 mV steps (see inset in A). B, experimental steady-state activation functions were obtained for IKv4.3 using a two-pulse protocol. Ten-millisecond voltage pulses, P1, applied from a holding potential −90 mV ranged between −120 and +50 mV (10 mV increment), with P2 set at −40 mV and 500 ms duration (inset in B). Data recorded at [K+]o 2 (n = 3) and 98 mm (n = 5), are represented by ○ and •, respectively. C, the time constants of activation (τact) were determined by fitting the rising phase of IKv4.3 obtained during both 10 and 1000 ms depolarizing pulses (inset in C). Current traces were then fitted with the function fa(t) = C(1 − exp(−t/τact))4. The data obtained with a 1000 ms pulse are shown by ○ (2 mm[K+]o, n = 5) and • (98 mm[K+]o, n = 4). Experimental data obtained at 2 mm[K+]o using a 10 ms pulse (n = 4) are shown as □. Dashed and continuous lines show fits of τact(V) with single- and double-exponential functions, respectively. All data shown in this figure were obtained using the cut-open oocyte voltage clamp technique.

