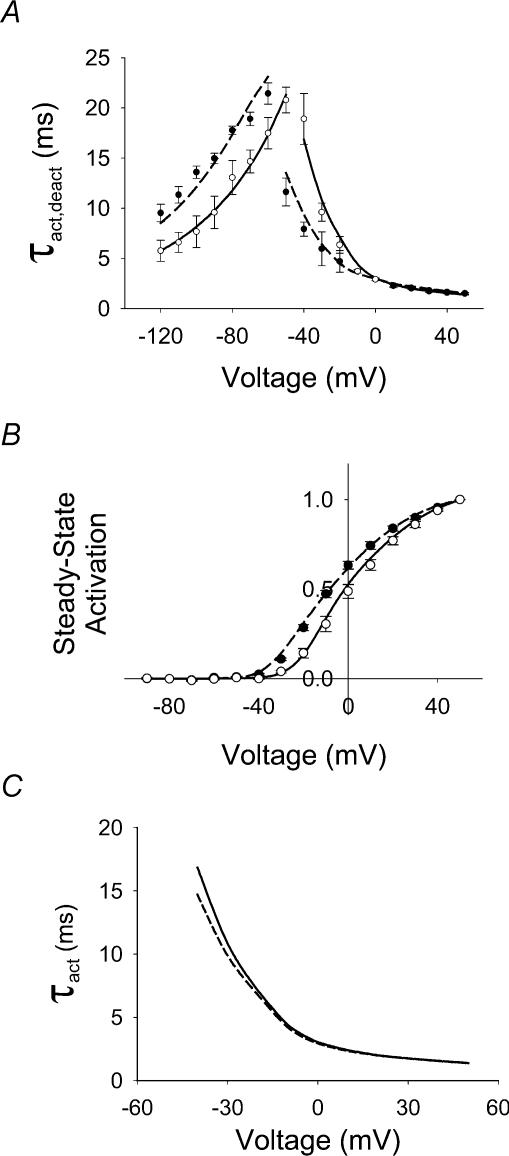
Figure 5. Comparison between simulated and experimental data.
A, experimental and simulated voltage dependence of the kinetics of activation (τact) and deactivation (τdeact) of the IKv4.3. The time constants of activation are the same as shown in Fig. 3C. The time constants of deactivation were obtained from the experimental traces of IKv4.3 using single exponential fitting function for 2 (○, n = 3) and 98 mm (•, n = 3) [K+]o. Unfilled and filled symbols with error bars represent plotted experimental data for 2 and 98 mm[K+]o, respectively. Continuous and dashed lines show calculated values for 2 and 98 mm[K+]o, respectively. The deactivation two-pulse protocol was the same as in Fig. 4. B, experimental (circles) and simulated (continuous and dashed lines) steady-state activation functions. Symbols are the same as in A. C, voltage dependence of τact obtained from simulations using the discrete state Markov model of Kv4.3 channel activation, without (continuous line) and with (dashed line) an incorporated inactivated state. Simulated data almost coincide in the voltage range from 0 to +50 mV. Small differences in the estimation of (τact) in the voltage range from −40 to 0 mV were observed. Voltage clamp protocol used for simulation is the same as in Fig. 1. Data shown in A and B in this figure were obtained using the cut-open oocyte voltage clamp technique.

