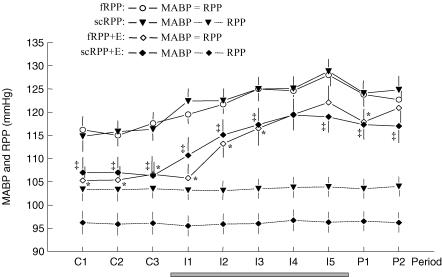
Figure 1. 20-min mean values of systemic mean arterial blood pressure (MAPB) and renal perfusion pressure (RPP).
Values are mean ±s.e.m. of 9 dogs studied in 4 protocols during 3 control periods (C1-C3), 5 periods with Na+ loading by i.v. infusion (I1–I5) and 2 postinfusion periods (P1, P2). Grey bar indicates period of infusion. RPP was free to change with MABP in protocols fRPP and fRPP + E (E = Enalapril), and was servocontrolled at pre-set reduced levels in protocols scRPP and scRPP + E. Individual pre-set levels of servocontrol of RPP were used to account for the interindividual variability of control MABP. For these protocols, RPP is plotted separately (error bars mirror individual pre-set levels). Significant differences obtained by GLM ANOVA for repeated measurements followed by Duncan's multiple comparison test: * significant versus fRPP, ‡ significant versus scRPP; within each protocol, MABP was higher during I2 through P2 as compared with control periods.

