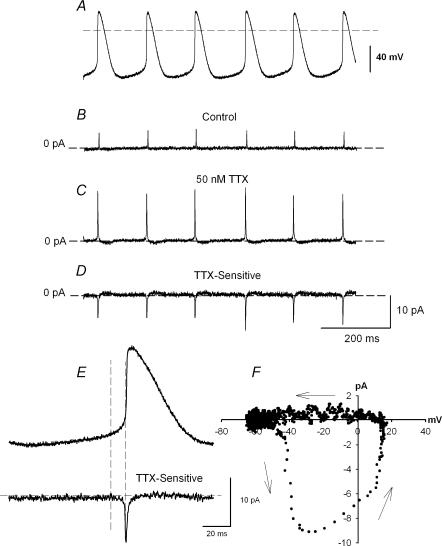
Figure 3. Action potential clamp recording of TTX-sensitive iNa.
A, spontaneous action potentials used as voltage clamp command waveform in the same cell. B, current recorded under control conditions. C, current recorded during superfusion of 50 nm TTX. D, TTX-sensitive current (obtained by subtracting C from B). E, action potential command waveform and the TTX-sensitive current at a fast time base. F, current–voltage relationship of TTX-sensitive iNa obtained from E (the TTX-sensitive current is plotted against the membrane potential).

