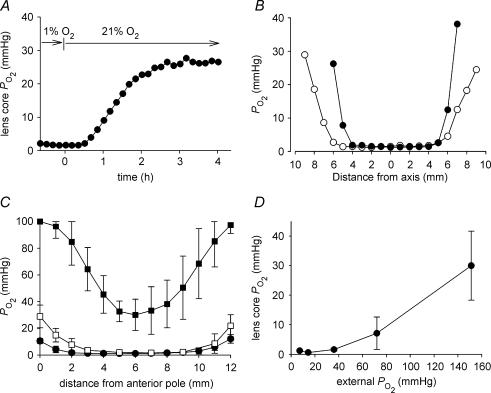
Figure 1. The relationship between internal and external PO2 in the isolated bovine lens.
A, the optode tip was inserted into the lens core and the response of core PO2 to a change in the oxygen concentration of the bathing medium (from 1 to 21%) was monitored. Note that a new steady-state value was established within 4 h. B, intralenticular PO2 profiles were recorded from a single lens along the polar (•) or equatorial axis (○). Measurements were made in tissue equilibrated with 5% external oxygen. The profiles are symmetric and exhibit steep cortical PO2 gradients and a central region of low (1–2 mmHg) PO2. C, internal PO2 profiles were measured in bovine lenses equilibrated with 1% (•), 5% (□), or 21% oxygen (▪). In each case, data represent the mean ±s.d. of at least six independent measurements. Note that the upper measurement limit for the optode system is 100 mmHg. This value is exceeded in the peripheral cell layers of lenses incubated in 21% oxygen. The slope of the PO2 profile in the outer 2–3 mm of tissue is artificially reduced as a consequence. D, the relationship between internal PO2(measured in the centre of the lens) and external PO2 was determined in isolated bovine lenses. Note that the PO2 in the centre of the lens does not increase until external PO2 is raised to supraphysiological values (≥ 70 mmHg). Data represent at least six independent measurements at each oxygen concentration.

