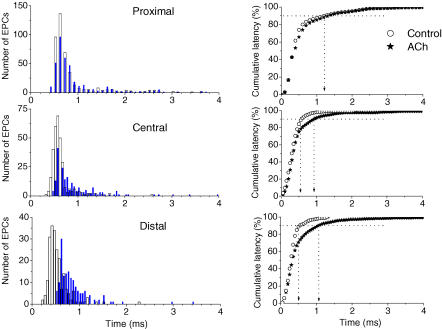
Figure 3.
Latency histograms and cumulative plots of latencies of the uniquantal EPCs recorded simultaneously by three microelectrodes located in proximal, central and distal regions of the same endplate before ACh (Control: open circles and columns) and after ACh application (filled columns and asterisks). Left, non-corrected latency histograms (values of minimal synaptic latencies were not subtracted) of the uniquantal EPCs (data from a single experiment). The bin size was 0.05 ms. Right, the cumulative plots of latencies for the same data, corrected for minimal synaptic delays. The vertical dotted lines indicate the times when 90% of the quanta have been released (P90) in the proximal, central and distal regions.

