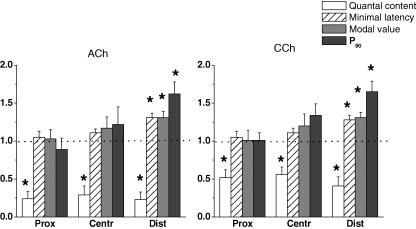
Figure 4.
Effects of 5 × 10⁻⁴ m acetylcholine (ACh) and 1 × 10⁻⁵ m carbachol (CCh) on the quantal contents, minimal latencies, mean modal values of the latency histograms and the P90 parameter in the proximal, central and distal regions of the synapse. The values (means ± s.e.m.) from 5–6 endplates are normalized to the controls before application of the drugs (1.0). Asterisks indicate statistically significant differences at P < 0.05.

