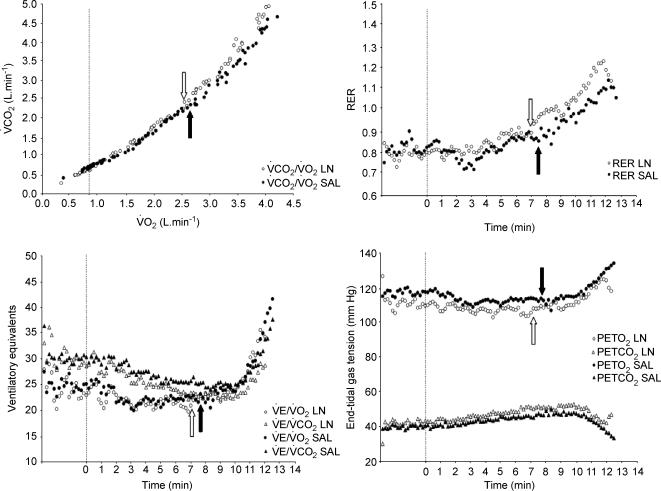
Figure 5. Determination of the gas exchange threshold (GET) using a ‘cluster’ of gas exchange indices.
Upper left panel illustrates the metabolic rate at which there is a disproportionate increase in CO2 output (‘V-slope’ method; Beaver et al. 1986); lower left panel shows the ventilatory equivalents for O2 and CO2; upper right panel shows the respiratory exchange ratio; and lower right panel shows the end-tidal gas tension responses to exercise following the inhibition of nitric oxide synthase (○) and following a placebo infusion (•) in a typical subject. See text for further information. GET in each condition is shown by the open and filled arrows, respectively. There was no significant difference in the group mean GET between conditions.

