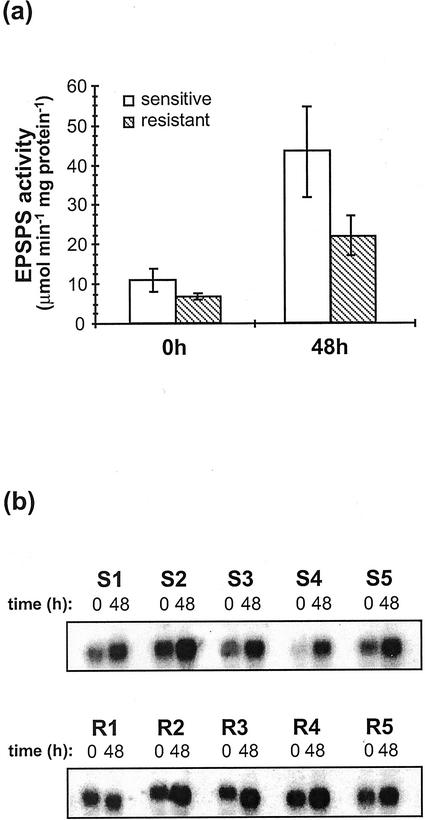
Figure 1.
Basal and induced EPSPS expression levels in glyphosate-sensitive and -resistant goosegrass individuals. Two clones were generated from each representative plant; (S) clones were spray-treated with 0.5 kg acid equivalent (a.e.) ha−1 glyphosate and (R) clones were treated with 2 kg a.e. ha−1 glyphosate. Clones were harvested immediately (time [t] = 0 h) or 48 h post-treatment (t = 48 h), then independently analyzed for EPSPS activity and mRNA levels. a, EPSPS activity levels. Extracts prepared from crown tissues were radiometrically assayed for EPSPS activity (see “Materials and Methods”). Specific activities were calculated based on extract protein concentration and all assays were performed in triplicate. Each bar represents the mean activity observed within five individuals from each biotype. Error bars indicate sds. b, RNA-blot analysis. Ten micrograms of total RNA, isolated from crown tissues, was loaded per lane, then size fractionated on 1.0% (w/v) agarose gels containing 0.66 m formaldehyde and transferred to nylon membranes. Blots were hybridized with an L. rigidum 32P-labeled EPSPS cDNA. S1 through S5 samples were isolated from duplicate clones derived from five different (S) individuals; R1 through R5 samples were isolated from duplicate clones derived from five different (R) individuals.

