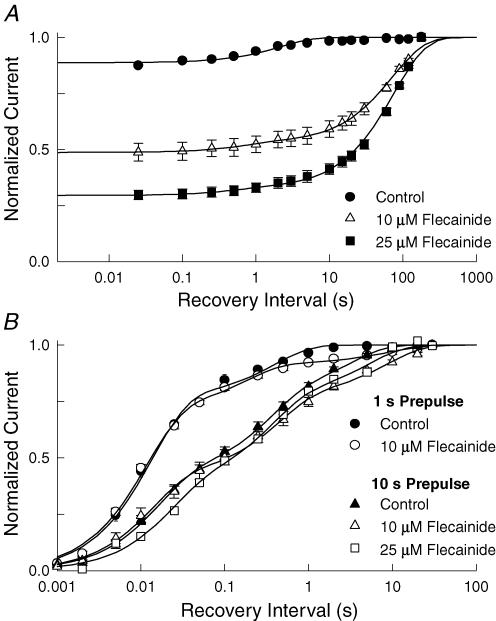
Figure 2. Flecainide slows the recovery of Nav1.5 channels.
A, flecainide inhibition was induced by applying 100 depolarizing pulses (−10 mV, 20 ms) at a frequency of 10 Hz. The voltage was then returned to −100 mV for a variable duration (0.025–180 s) before applying a standard test pulse (−10 mV, 20 ms). The peak current amplitudes (I) elicited by test pulses were normalized to the current measured after a prolonged rest (180 s) at −100 mV (Io) and plotted versus the recovery interval. The continuous curves are fits to either a single or biexponential function [I/Io = 1 − (A1(t/τ1) + A2(t/τ2)] where τ and A are the time constants and the corresponding relative amplitudes. The data had time constants (relative amplitude) of 2.5 ± 0.3 s (A = 0.11 ± 0.01) for the control (n = 12), τ1 = 0.7 ± 0.2 s (A1 = 0.04 ± 0.01) and τ2 = 75.3 ± 4.5 s (A2 = 0.47 ± 0.01) for 10 μm (n = 5), and τ1 = 0.4 ± 0.1 s (A1 = 0.02 ± 0.02) and τ2 = 81.3 ± 3.2 s (A2 = 0.75 ± 0.01) for 25 μm flecainide (n = 6). B, channels were inactivated by applying 1 or 10 s depolarizing pulses to −10 mV before returning to −100 mV for a variable duration (1 ms–30 s). A standard test pulse (−10 mV, 20 ms) was used to assay the fractional current (I), which was normalized to the current measured after holding at −100 mV for 120 s (Io) and plotted versus the recovery interval (t). The continuous curves are fits of the data to either the sum of three exponential components [I/Io = 1 − (A1 exp(− t/τ1) + A2 exp(− t/τ2) + A3 exp(− t/τ3))] where τ1 − τ3 are the recovery time constants and A1 – A3 are the corresponding relative amplitudes. The fitted parameters are listed in Table 1.

