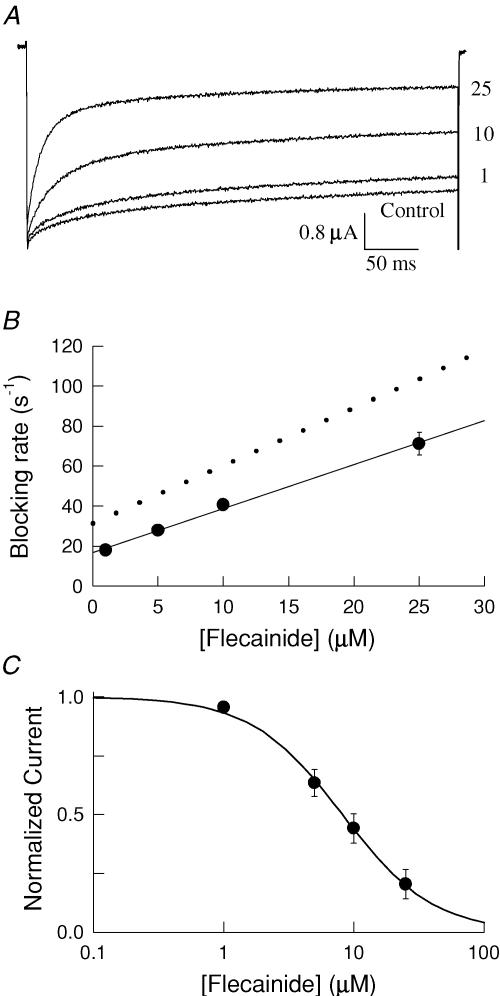
Figure 5. Flecainide block of the QQQ-I1756C mutant.
A, current of the QQQ-I1756C mutant channels before and after bath application of flecainide (1–25 μm). Currents were elicited by depolarizing to −10 mV for 400 ms from a holding potential of −100 mV. The decay of the current was fitted with either one (control) or the sum of two exponential components (flecainide). B, the effective blocking rates (1/τf) were plotted versus the flecainide concentration. The association and dissociation rate constants are listed in Table 2. The dotted line is a regression fit describing the blocking kinetics of the QQQ mutant measured in 100% Na+ redrawn from Fig. 3B. C, the current measured at the end of the 400 ms depolarizing pulses (A) was normalized to drug-free controls and plotted versus the flecainide concentration. The continuous curve is a fit of the data to a single site model with KD of 8.5 ± 1.5 μm (n = 8).

