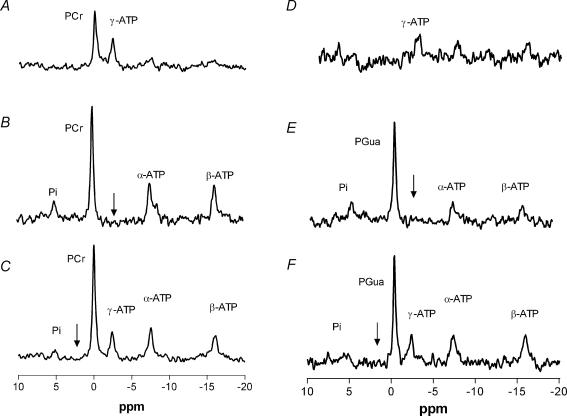
Figure 4. Typical saturation transfer spectra of a WT and a GAMT–/– mouse hindleg.
The appropriate control spectra (C and F), a spectrum with a 5000 ms (B) or a 3000 ms (E) saturation pulse applied at the frequency of γ-ATP and the corresponding difference spectra (A and D). Arrows denote the frequency of the selective saturation pulse. Spectra A–C are of a WT mouse, D–F of a GAMT–/– mouse.

