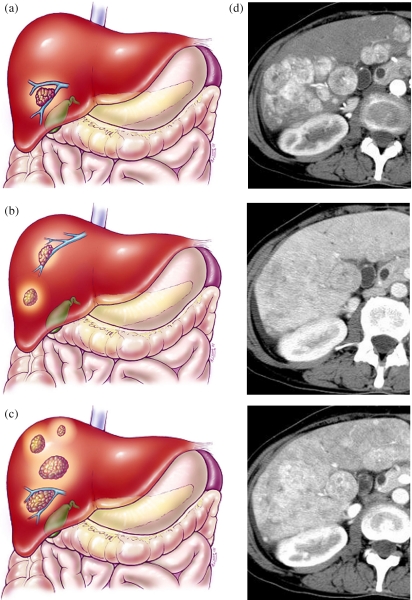
Figure 4.
Hepatocellular carcinoma TNM system—T3. Color diagrams demonstrating T3 lesion staging. (a) T3a is a solitary tumor >2 cm with vascular invasions. (b) A T3b lesion consists of multiple tumors limited to one lobe <2 cm with vascular invasion. (c) A T3c lesion consists of multiple tumors limited to one lobe of the liver measuring >2 cm with or without vascular invasion. (d) Multiphasic CT scan showing T3c lesions: HAP, LAP, HVP.

