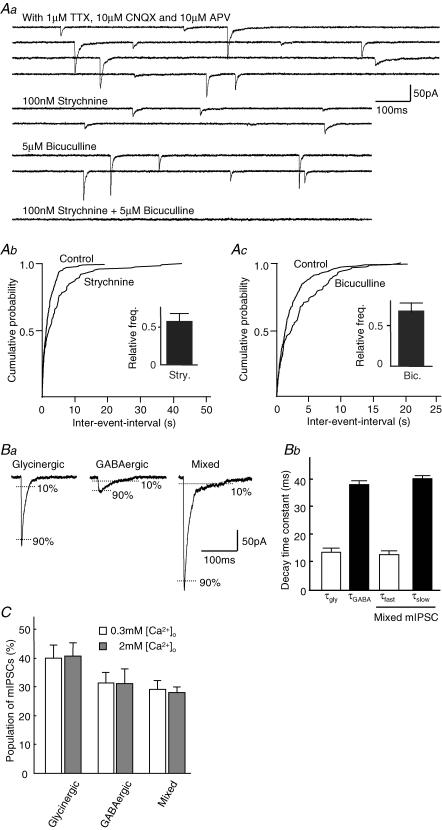
Figure 1. Pharmacological isolation of glycinergic and GABAergic mIPSCs.
All experiments were performed in the presence of 1 μm TTX, 10 μm CNQX and 10 μm AP5 (APV) at a VH of −60 mV. Aa, typical traces of mIPSCs with or without glycine receptor antagonist, strychnine (100 nm) and/or GABAA receptor antagonist, bicuculline (5 μm). Ab, Ac, cumulative histograms of mIPSCs frequency in the presence and absence of strychnine (Ab) or bicuculline (Ac). Inset shows the averaged relative mIPSC frequency in the presence of strychnine (Ab) or bicuculline (Ac) from four neurones. Ba, typical traces of glycinergic and GABAergic mIPSCs are shown. Decay time constants were defined as the time for the mIPSC to decay from 90% to 10% of the peak amplitude. Note the different decay time constants between these mIPSCs. Bb, summary data of the averaged decay time constants of mIPSCs are shown (n = 11). Note that the τfast of the mixed mIPSCs corresponds to τgly, whereas the τslow of the mixed mIPSCs corresponds to τGABA. C, population of glycinergic, GABAergic and mixed mIPSCs in normal and low [Ca2+]o. The results were expressed as percentage of all events and represent the mean + s.e.m. from 11 neurones.

