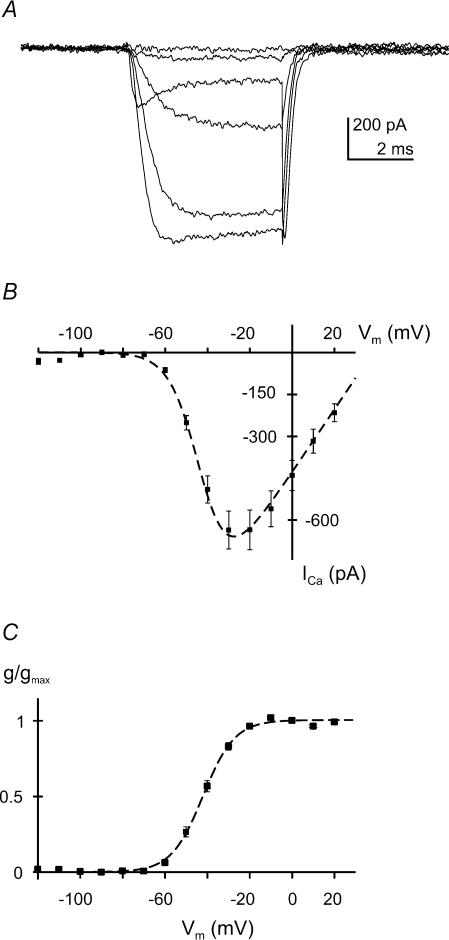
Figure 2. Voltage-activated Ca2+ current in saccular hair cells.
A, representative traces of voltage-activated Ca2+ currents obtained for a range of test potentials from −120 to +20 mV from a holding potential of −85 mV. B, current–voltage relation of the voltage-activated Ca2+ currents. Voltages were corrected for series resistance and data values were interpolated to the voltages indicated using the cubic spline method. Vertical bars indicate s.e.m. (n = 9). The dashed line was calculated according to eqn (1): I = gmax (V − Vrev)/1 + exp((V½ − V/k)) where gmax = 0.011 nS, Vrev = 39.2 mV, V½ = −41.9 mV and k = 7.05 mV, taken as the averages from fits to I–V curves from individual cells (see Methods). C, conductance–voltage relationship. The average conductance data were fitted with a Boltzman distribution (eqn (2)(g/gmax = 1/(1 + exp ((V½ − V)/k)) (dashed line; V½ = −42.0 mV, k = 7.5 mV).

