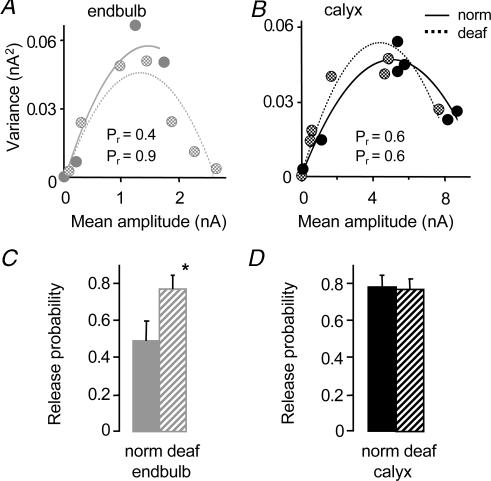
Figure 5. Deafness affects quantal parameters differently at the calyx versus the endbulb synapse.
A,B, variance–mean analysis of individual cells shows difference in release probability (curvature of parabola) between deaf (broken line) and normal mice (solid line) at the endbulb but not the calyx synapse. Quantal amplitude (initial slope of parabola) was similar in deaf versus normal mice at both synapses. C, summary data showing release probability at the endbulb synapse is 60% greater in deaf (hatched grey bar) versus normal mice (solid grey bar). (Endbulb data in C from Oleskevich & Walmsley, 2002.) D, release probability at the calyx synapse is similar in deaf (hatched black bar) and normal mice (solid black bar). *Significant difference (P < 0.05) from normal animals. Error bars are s.e.m.

