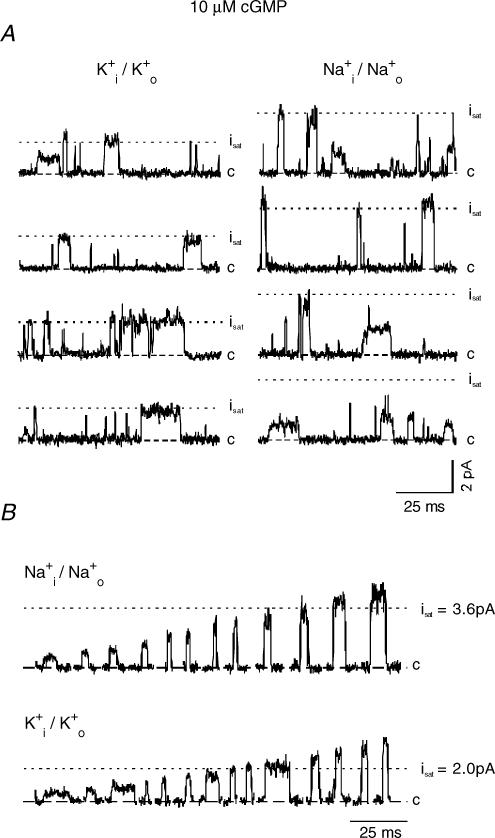
Figure 2. Single CNGA1 channel currents at low cGMP (10 μm) with either symmetrical Na+ or K+ ions.
The dotted lines indicate the current level observed at saturating cGMP (700 μm; see Fig. 1). A, representative current traces. Openings to sublevels, the level observed at saturating cGMP, and superlevels appeared with both ions. B, selected openings in order of amplitude.

