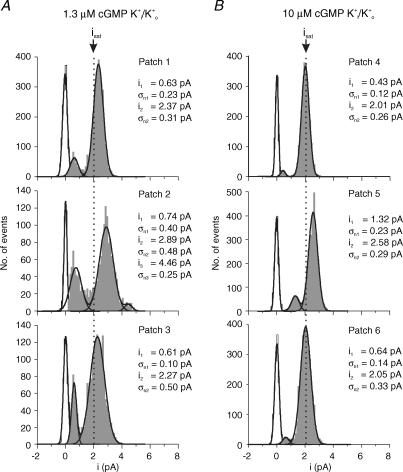
Figure 4. Amplitude histograms of single-channel openings with K+i/K+o recorded from six patches.
For an explanation of conditions and symbols see Fig. 3. A, 1.3 μm cGMP. The histograms of the patches show either two or three Gaussian distributions. B, 10 μm cGMP. As at 1.3 μm cGMP, the distributions differ notably and they shift more to isat. The RMS noise of the main peaks (σn2) still exceeds that at saturating cGMP (Table 1).

