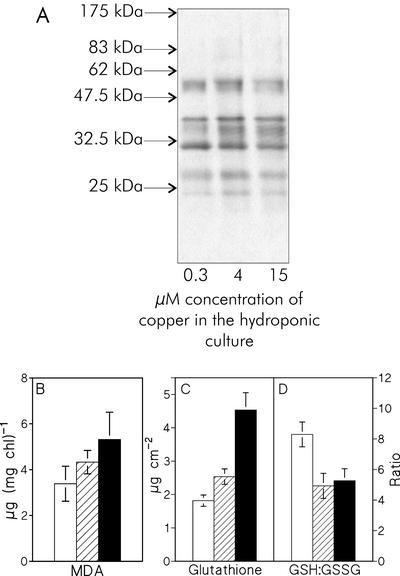
Figure 2.
A, Oxyblot visualizing carbonyl groups in thylakoid proteins. The thylakoids were isolated from control bean plants (0.3 μm Cu2+) and from bean plants grown at 4 and 15 μm Cu2+. Each sample contained 7.5 μg of soluble protein. The arrows mark the positions of Mr standards. B, The amount of malondealdehyde (MDA) of the thylakoids isolated from the bean leaves, measured with the thiobarbituric acid method. C, The amount of total glutathione determined from the bean leaves; D, the ratio of GSH to GSSG. In B through D, white, hatched, and black bars correspond to plants grown in the presence of 0.3 (control), 4, and 15 μm Cu2+ in growth medium, respectively. Each bar represents the mean of three independent experiments, and the error bars show se.

