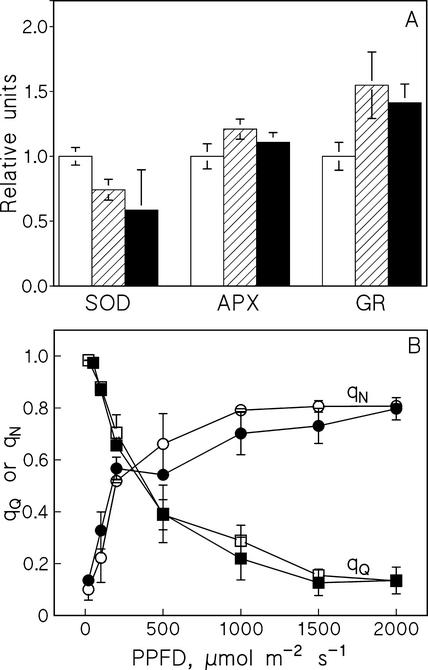
Figure 3.
A, Activities of SOD, APX, and GR measured from the first trifoliate leaves of bean plants after 2 weeks of growth in the presence of 0.3 μm Cu2+ (control plants; white bars), 4 μm Cu2+ (hatched bars), or 15 μm Cu2+ (black bars). B, The coefficient of nonphotochemical (qN, circles) and photochemical (qQ, squares) quenching of Chl fluorescence in leaves of control beans (white symbols) and leaves of bean plants grown in the presence of 4 μm Cu2+ (black symbols). Fluorescence was measured with a PAM fluorometer after 5 min of illumination at each PPFD, and far-red illumination was used to measure F0 ' after each white light illumination period. Each data point shows the mean of four independent experiments, and the error bars show se.

