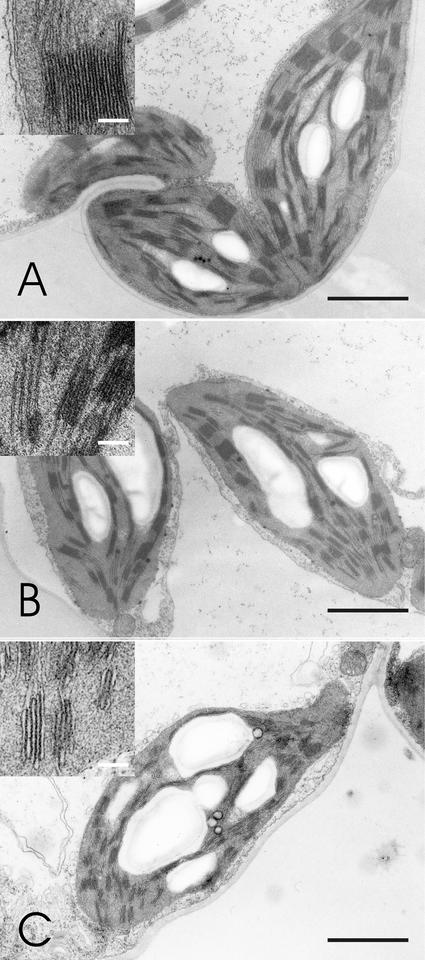
Figure 4.
Electron micrographs of bean chloroplasts. A, Chloroplasts of a control plant. B, Chloroplasts of a plant grown in the presence of 4 μm Cu2+. C, Chloroplasts of a plant grown in the presence of 15 μm Cu2+. Black bar = 2 μm. The upper left corner of each image shows a magnification of a grana stack; white bar = 0.2 μm.

