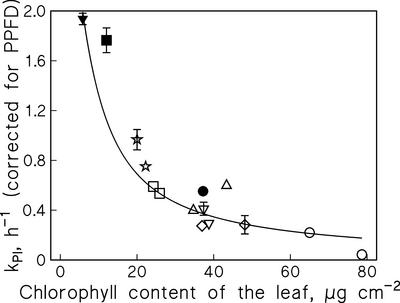
Figure 5.
Dependence of photoinhibition on Chl concentration. Lincomycin-treated leaves of Sinapis alba (⋆), Alliaria petiolata (□), Plantago major (▵), Tilia platyphyllos (⋄), Alchemilla vulgaris (▿), and Aesculus hippocastanum (○) were illuminated at the PPFD of 1,500 μmol m−2 s−1. The kPI values are based on measurements of oxygen evolution. The kPI values of control bean leaves (●) and from leaves of beans grown in the presence of 4 μm Cu2+ (▪) or 15 μm Cu2+ (▴) were multiplied by 1.5 to compensate for the lower PPFD (1,000 μmol m−2 s−1) used to obtain these values. The bean data is from Pätsikkä et al. (1998). The line is the best fit to Equation 1, each data point corresponds to an independent experiment, and the error bars, drawn if larger than the symbol, indicate se of the curve fit.

